How can you determine if your Celery queues are healthy or overwhelmed with tasks?
Anything from sudden surges of user traffic to abuse of your app can drag down your Celery cluster. Knowing when this is happening is half the battle.
Our goal in this series is to build automated monitoring tools for Celery so that you don't have to find out about problems from your users.
Monitoring Queue Wait Times
There are many valuable metrics to monitor such as queue length, processing time, failed task count, etc.
But we're going to start with what I think is the most effective metric to monitor: queue wait times.
Queue wait time is simply how long a task spends waiting in the queue before a worker accepts it and begins processing.
Queue length is important, but harder to judge. What constitutes too many tasks in the queue? For one service, having 10 items in the queue might be too many, while 100,000 is perfectly normal for another service.
It's also easy to have short bursts where the queue grows, but as long as the workers process them quickly enough, is it really an issue? This can lead to false alarms.
Queue wait times, on the other hand, are a true reflection of your user's experience.
Let's say you have a Django app that auto-tunes videos of people singing. You also implemented a helpful progress bar. A user uploads a video of themselves singing a Beyonce song, but the progress bar doesn't budge for several minutes. That user gives up, and tells all their friends that the app doesn't work.
What happened? Tasks may have still been processing, but the queue wait time was too high.
Setting Up the Example Django App
Let's build a very simple Django app to demonstrate how to monitor Celery queue wait times.
We'll use Docker to make it simpler to set up Celery and Redis.
Create the Django project.
django-admin startproject djautotune
cd djautotune
python3 manage.py startapp core
Update the djautotune/settings.py file to add the core application. We'll also add the Celery related settings while we're editing the file.
INSTALLED_APPS = [
    "django.contrib.admin",
    "django.contrib.auth",
    "django.contrib.contenttypes",
    "django.contrib.sessions",
    "django.contrib.messages",
    "django.contrib.staticfiles",
    "core",
]

REDIS_HOST = os.environ["REDIS_HOST"]
REDIS_PORT = os.environ["REDIS_PORT"]

CELERY_METRICS_TTL = int(os.environ.get("CELERY_METRICS_TTL", 300))

CELERY_IMPORTS = ("core.tasks",)
CELERY_BROKER_URL = os.environ["CELERY_BROKER_URL"]
CELERY_RESULT_BACKEND = os.environ["CELERY_RESULT_BACKEND"]
CELERY_ACCEPT_CONTENT = ["json"]
CELERY_TASK_SERIALIZER = "json"
CELERY_RESULT_SERIALIZER = "json"
Adding the Celery Worker Entrypoint
Create a new file named celery.py in the same directory as the settings.py file. This file acts as the entrypoint for the Celery worker.
import os
from celery import Celery

os.environ.setdefault("DJANGO_SETTINGS_MODULE", "djautotune.settings")

app = Celery("djautotune")
app.config_from_object("django.conf:settings", namespace="CELERY")
app.autodiscover_tasks()
Implementing the Background Task Logic
Now create the core/tasks.py file to contain our task logic.
Since actually auto-tuning videos is beyond the scope of this tutorial, we'll add some dummy code that simulates the workload.
import random
import time

from celery import shared_task

@shared_task
def autotune():
    short_duration = random.uniform(0.5, 2)  # Short duration for most tasks
    medium_duration = random.uniform(2, 5)  # Medium duration for 10% of tasks
    long_duration = random.uniform(5, 10)  # Long duration for 1% of tasks (P99)

    probability = random.random()

    if probability < 0.90:
        time_to_sleep = short_duration
    elif probability < 0.99:
        time_to_sleep = medium_duration
    else:
        time_to_sleep = long_duration

    time.sleep(time_to_sleep)
Creating a View to Invoke the Background Task
We'll need a way to invoke this new autotune Celery task. Open core/views.py to add the following HTTP endpoint.
from django.http import JsonResponse
from django.views.decorators.csrf import csrf_exempt
from .tasks import autotune

@csrf_exempt
def enqueue_autotune_task(request):
    if request.method == "POST":
        result = autotune.delay()
        return JsonResponse(
            {"task_id": result.task_id, "status": "Task submitted successfully!"},
            status=200,
        )
    else:
        return JsonResponse({"error": "Only POST method is allowed."}, status=405)
Now, as usual, you'll need to add the new route to your Django router config.
To start, add the following in the core/urls.py file.
from django.urls import path
from . import views

urlpatterns = [
    path("autotune/", views.enqueue_autotune_task, name="enqueue_autotune_task"),
]
Finally, update the main urls.py file to include the routes from the core app.
from django.contrib import admin
from django.urls import include, path

urlpatterns = [
    path("admin/", admin.site.urls),
    path("", include("core.urls")),
]
Setting Up the Docker Development Environment
Create the requirements.txt file.
Django==4.2.4
redis==4.5.5
celery==5.2.7
Create the Dockerfile for the Django app in the root project directory.
FROM python:3.11

ENV PYTHONDONTWRITEBYTECODE 1
ENV PYTHONUNBUFFERED 1

WORKDIR /usr/src/app

COPY requirements.txt /usr/src/app/

RUN pip install --no-cache-dir -r requirements.txt

COPY . /usr/src/app/

RUN mkdir -p /usr/src/app/
Now create the docker-compose.yml to manage the containers.
version: '3.8'

services:
  web:
    build:
      context: .
      dockerfile: Dockerfile
    command: python manage.py runserver 0.0.0.0:8000
    volumes:
      - ${PWD}:/usr/src/app
    environment:
      - CELERY_BROKER_URL=redis://redis:6379/0
      - CELERY_RESULT_BACKEND=redis://redis:6379/0
      - CELERY_METRICS_TTL=300
      - REDIS_HOST=redis
      - REDIS_PORT=6379
    ports:
      - "8000:8000"
    depends_on:
      - redis

  celery:
    build:
      context: .
      dockerfile: Dockerfile
    command: celery -A djautotune worker --loglevel=info
    volumes:
      - ${PWD}:/usr/src/app
    environment:
      - CELERY_BROKER_URL=redis://redis:6379/0
      - CELERY_RESULT_BACKEND=redis://redis:6379/0
      - CELERY_METRICS_TTL=300
      - REDIS_HOST=redis
      - REDIS_PORT=6379
    depends_on:
      - redis

  redis:
    image: redis:latest
    ports:
      - "6379:6379"
Starting Up and Testing the App
You should be ready to start the app now with the docker-compose up command.
If all goes well, you can enqueue a task with the following curl command.
curl -X POST http://localhost:8000/autotune/
Using the docker logs command on the Celery container, you should be able to see a success message like this for the task.
Task core.tasks.autotune[9cdfcb7d-1f65-49cc-aa33-20c694157e61] succeeded in 1.9952244879677892s: None
Adding the Celery Monitoring Logic
We have a functioning background task, but no monitoring to speak of.
To add monitoring, we'll create a Django view that returns the longest queue wait time in the past 30 seconds. The window of time can be easily adjusted, but it's important that we use a sliding window of some length.
We'll use a Redis sorted set with an expiration to create the sliding window of queue wait times.
Marking New Tasks with a Start Timestamp
The first step is to mark each new task with a timestamp.
This timestamp represents the moment the task was created and published, but before any worker has picked up the task.
Open core/apps.py and add the following.
import time
from django.apps import AppConfig
from celery.signals import before_task_publish

def before_task_publish_handler(sender=None, headers=None, body=None, **kwargs):
    headers["__metadata__"] = {"publish_timestamp": time.time()}

class CoreConfig(AppConfig):
    default_auto_field = "django.db.models.BigAutoField"
    name = "core"

    def ready(self):
        before_task_publish.connect(before_task_publish_handler)
Recording Queue Wait Time in Redis
Once a worker has picked up the task, we need to calculate the elapsed time and store it in Redis.
Since we're using the task_prerun signal, this represents the moment the task was picked up, and does not include actual processing time.
Open djautotune/celery.py and add the following.
import time
import os
import redis

from celery import Celery
from celery.signals import task_prerun
from django.conf import settings

os.environ.setdefault("DJANGO_SETTINGS_MODULE", "djautotune.settings")

app = Celery("djautotune")
app.config_from_object("django.conf:settings", namespace="CELERY")
app.autodiscover_tasks()

redis_client = redis.Redis(host=settings.REDIS_HOST, port=settings.REDIS_PORT, db=0)

@task_prerun.connect
def task_prerun_handler(task_id, task, *args, **kwargs):
    metadata = getattr(task.request, "__metadata__", {})
    publish_timestamp = metadata.get("publish_timestamp")

    if publish_timestamp:
        elapsed_time = time.time() - publish_timestamp

        redis_client.zadd("task_elapsed_times", {task_id: elapsed_time})
        redis_client.expire("task_elapsed_times", settings.CELERY_METRICS_TTL, nx=True)
The zadd call adds the queue wait time to the sorted set. The set is sorted by the queue wait time, so it's efficient to request the greatest value, which will be important when we add a view to ask for this value.
Because the expire call is passed nx=True, only the initial call sets the expiration. In other words, even though expire is called for each task, the expiration is not reset. Eventually, the key task_elapsed_times will expire, and an entirely new sorted set is created with a new expiration.
Requesting the Longest Queue Wait Time
For the final piece of the puzzle, let's create a view to return the longest queue wait in the current time window (as defined by the CELERY_METRICS_TTL setting).
Open core/views.py and add the following view code.
import redis

from django.conf import settings
from django.http import JsonResponse
from django.views.decorators.csrf import csrf_exempt
from .tasks import autotune

def max_queue_wait_time(request):
    redis_client = redis.Redis(host=settings.REDIS_HOST, port=settings.REDIS_PORT, db=0)

    max_time_data = redis_client.zrevrange("task_elapsed_times", 0, 0, withscores=True)
    max_elapsed_time = max_time_data[0][1] if max_time_data else 0

    return JsonResponse({"max_elapsed_time": max_elapsed_time})
Setting Up Alerting for Celery
We'll use Cronitor to set up alerting so that we receive a notification when queue wait times become too high.
To do this, Cronitor will make requests to our max_queue_wait_time endpoint and parse the JSON response.
This means that Cronitor must have an endpoint that it can reach. Normally, we can't do that when developing on a personal machine. For this tutorial, however, we can use ngrok to establish a tunnel to our local Django application for testing purposes.
Using Ngrok to Establish a Tunnel
Head over to ngrok and sign up for a free account.
Download the CLI tool, enter your token, and open a tunnel with the following command.
ngrok http 8000
Copy the domain that is listed next to the Forwarding column.
Adding the Celery Check in Cronitor
Sign up for a free account with the Cronitor service.
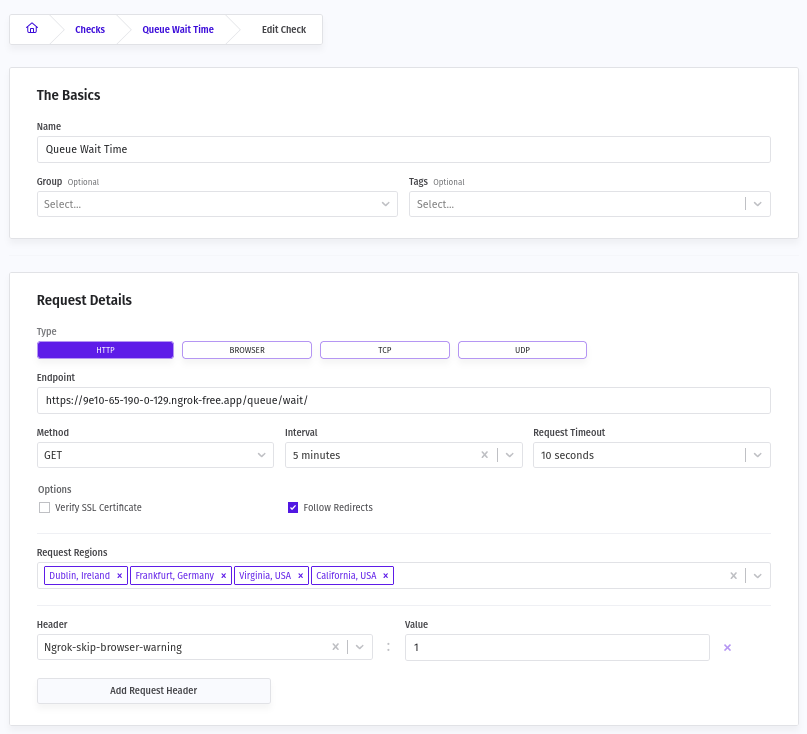
Add a new Check with details similar to the following. Remember to add your own Ngrok domain.
Take note of the ngrok-skip-browser-warning header and be sure to add that.

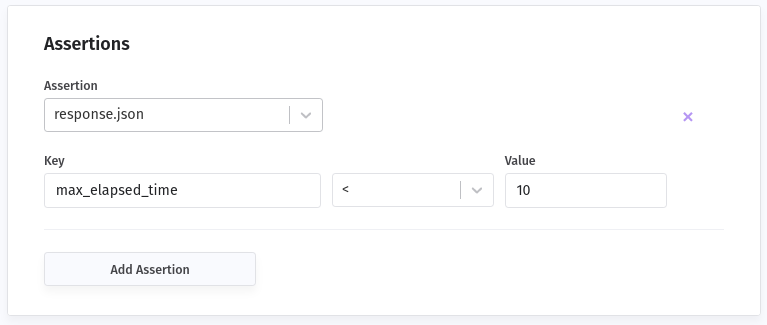
Under the assertions section, set up the following so that Cronitor understands when to trigger an alert.

This means that Cronitor will fire an alert when max_elapsed_time exceeds 10 seconds. You can of course adjust this time to whatever metric suits your application.
Here's an example of what happened when I added a huge number of tasks so that my Celery queue became overwhelmed.

Further Celery Monitoring Enhancements
You've learned how to monitor queue wait time, a metric that directly reflects what your users are experiencing.
This is a great start, but there's a lot more to monitoring your service comprehensively.
As a sneak peek, in the next article we'll learn how to monitor more Celery stats, such as failed tasks and retries. We'll also dive into building a custom Celery monitoring dashboard using Bokeh.
You can see the entire djautotune sample project on GitHub if you'd like to copy some of the code as a template.
